From Wikipedia
The Keeling Curve also shows a cyclic variation of about 5 ppmv in each year corresponding to the seasonal change in uptake of CO2 by the world's land vegetation. Most of this vegetation is in the Northern hemisphere, since this is where most of the land is located. From a maximum in May, the level decreases during the northern spring and summer as newplant growth takes carbon dioxide out of the atmosphere through photosynthesis. After reaching a minimum in October, the level rises again in the northern fall and winter as plants and leaves die off and decay, releasing the gas back into the atmosphere.[13]
When C.D. Keeling published his 1960 paper, there did not appear to be any evidence of oceanic absorption. Keeling conjectured that this might be attributable to fluctuations in the causation of the seasonal variation, within the small number of years since his measurements had begun. However it is now understood that allowance should be made for about 50% absorption by the oceanic sinks.[17]
------------------------------------------------------
Satellite derived data of seasonal CO2
Sunday, June 29, 2014

Cooling of Atmosphere Due to CO2 Emission
(behind paywall, found most of it here)
Conclusions
During the latest three millennia, one can observe a clear cooling trend in
the Earth's climate (Keigwin, 1996; Sorokhtin and Ushakov, 2002; Gerhard,
2004; Khiyuk and Chilingar, 2006; Sorokhtin et al., 2007). During this
period, deviations of the global temperature from this trend reached up to
3iC with a clear trend of decreasing global temperature by about 2iC.
Relatively short-term variations in global temperature are mainly caused by
the variations in solar activity and are not linked to the changes in carbon
dioxide content in atmosphere.
the Earth's climate (Keigwin, 1996; Sorokhtin and Ushakov, 2002; Gerhard,
2004; Khiyuk and Chilingar, 2006; Sorokhtin et al., 2007). During this
period, deviations of the global temperature from this trend reached up to
3iC with a clear trend of decreasing global temperature by about 2iC.
Relatively short-term variations in global temperature are mainly caused by
the variations in solar activity and are not linked to the changes in carbon
dioxide content in atmosphere.
Accumulation of large amounts of carbon dioxide in the atmosphere leads to
the cooling, and not to warming of climate, as the proponents of traditional
anthropogenic global warming theory believe (Aeschbach-Hertig, 2006). This
conclusion has a simple physical explanation: when the infrared radiation is
absorbed by the molecules of greenhouse gases, its energy is transformed
into thermal expansion of air, which causes convective fluxes of air masses
restoring the adiabatic distribution of temperature in the troposphere. Our
estimates show that release of small amounts of carbon dioxide (several
hundreds ppm), which are typical for the scope of anthropogenic emission,
does not influence the global temperature of Earth's atmosphere.
the cooling, and not to warming of climate, as the proponents of traditional
anthropogenic global warming theory believe (Aeschbach-Hertig, 2006). This
conclusion has a simple physical explanation: when the infrared radiation is
absorbed by the molecules of greenhouse gases, its energy is transformed
into thermal expansion of air, which causes convective fluxes of air masses
restoring the adiabatic distribution of temperature in the troposphere. Our
estimates show that release of small amounts of carbon dioxide (several
hundreds ppm), which are typical for the scope of anthropogenic emission,
does not influence the global temperature of Earth's atmosphere.
References
Arrhenius, S. 1896. On influence of carbonic acid in the air upon the
temperature of the ground. Phil. Mag. 41:237-276.
temperature of the ground. Phil. Mag. 41:237-276.
Aeschbach-Hertig, W. 2007. Rebuttal of "On global forces of nature driving
the Earth's climate. Are humans involved?" by L. F. Khilyuk and G. V.
Chilingar. Env. Geol.
the Earth's climate. Are humans involved?" by L. F. Khilyuk and G. V.
Chilingar. Env. Geol.
Bachinskiy, A. I., Putilov, V. V., and Suvorov, N. P. 1951. Handbook of
Physics. Moscow: Uchpedgiz, 380 pp.
Physics. Moscow: Uchpedgiz, 380 pp.
Gerhard, L. C. 2004. Climate change: Conflict of observational science,
theory, and politics. Am. Assoc. Petrol. Geol. Bull. 88:1211-1220.
theory, and politics. Am. Assoc. Petrol. Geol. Bull. 88:1211-1220.
Keigwin, L. D. 1996. The little ice age and medieval warm period in the
Sargasso Sea. Science 274:1504-1508.
Sargasso Sea. Science 274:1504-1508.
Khilyuk, L. F., Chilingar, G. V., Endres, B., and Robertson, J. 2000. Gas
Migration. Houston: Gulf Publishing Company, 389 pp.
Migration. Houston: Gulf Publishing Company, 389 pp.
Khilyuk, L. F., and Chilingar, G. V. 2003. Global warming: Are we confusing
cause and effect? Energy Sources 25:357-370.
cause and effect? Energy Sources 25:357-370.
Khilyuk, L. F., and Chilingar, G. V. 2004. Global warming and long-term
climatic changes: A progress report. Environ. Geol. 46:970-979.
climatic changes: A progress report. Environ. Geol. 46:970-979.
Khilyuk, L. F., and Chilingar, G. V. 2006. On global forces of nature
driving the Earth's climate. Are humans involved? Environ. Geol. 50:899-910.
driving the Earth's climate. Are humans involved? Environ. Geol. 50:899-910.
Landau, L. D., and Lifshits, E. M. 1979. Statistical Physics. Moscow: Nauka,
559 pp.
559 pp.
Marov, M. Ya. 1986. Planets of Solar System, Moscow: Nauka, 320 pp.
Robinson, A. B., Baliunas, S. L., Soon, W., and Robinson, Z. W. 1998.
Environmental effects of increased atmospheric carbon dioxide.
[in...@oism.org; in...@marshall.org]
Environmental effects of increased atmospheric carbon dioxide.
[in...@oism.org; in...@marshall.org]
Schimel, D. S. 1995. Global Change Biology, 1:77-91.
Sorokhtin, O. G. 1990. The greenhouse effect of atmosphere in geologic
history of Earth. Doklady AN SSSR 315:587-592.
history of Earth. Doklady AN SSSR 315:587-592.
Sorokhtin, O. G. 2001a. Greenhouse effect: Myth and reality. Vestnik Russian
Academy of Natural Sciences 1:8-21.
Academy of Natural Sciences 1:8-21.
Sorokhtin, O. G. 2001b. Temperature distribution in the Earth. Izvestiya
RAN, Physics of Earth 3:71-78.
RAN, Physics of Earth 3:71-78.
Sorokhtin, O. G., and Ushakov, S. A. 2002. Evolution of the Earth. Moscow:
Moscow Univ. Publishers, 560 pp.
Moscow Univ. Publishers, 560 pp.
Sorokhtin, O. G., Chilingar, G. V., and Khilyuk, L. F. 2007. Global Warming
and Global Cooling. Evolution of Climate on Earth. Amsterdam: Elsevier, 313
pp.
and Global Cooling. Evolution of Climate on Earth. Amsterdam: Elsevier, 313
pp.
Sorokhtin, O. G., Chilingar, G. V., Khilyuk, L. F., and Gorfunkel, M. V.
2006. Evolution of the Earth's global climate. Energy Sources 29:1-19.
2006. Evolution of the Earth's global climate. Energy Sources 29:1-19.
Venus (Atmosphere, Surface and Ecosystem). 1989. Moscow: Nedra, 482 pp.
Voytkevitch, G. V., Kokin, A. V., Miroshnikov, A. E., and Prokhorov, V. G.
1990. Handbook of Geochemistry. Moscow: Nedra, 480 pp.
1990. Handbook of Geochemistry. Moscow: Nedra, 480 pp.
Sunday, May 18, 2014
It's easy to explain to a skeptic
If you are skeptical. it's easy to show you why I suspect the climate data has serious issues. For example, the GISS data does not match the Alaska climate data. All stations except Barrow show cooling trend since 1979. Barrow shows a warming trend.
GISS map showing Alaska annual trend for 1978-2013

Actual data from climate stations


A climate skeptic probably doesn't even need it explained. A believer, it will not matter how carefully, how well, or how much evidence is used to explain. They always have a way to avoid discussing, or even seeing the evidence.
GISS map showing Alaska annual trend for 1978-2013
Actual data from climate stations
A climate skeptic probably doesn't even need it explained. A believer, it will not matter how carefully, how well, or how much evidence is used to explain. They always have a way to avoid discussing, or even seeing the evidence.
Wednesday, May 7, 2014
The NCDC changed temperature data of the past again
Recently past temperatures used by the NCDC CAG were changed, all of the changes resulted in making the past cooler. This is not a secret. But it clearly shows up when comparing their data now, to data used before the change.
The CAG for Alabama winter
Weather underground article discussing Alabama cooling in winter
CAG data before the change, temperatures have fallen at a rate of 0.6 degree per century.

After the change, no cooling trend at all

Looking at the exact same winter trend now shows no cooling at all. That is a huge change. The changes they made also makes all previous papers based on CAG wrong.
Changing data, changing the evidence, makes it very difficult to do evidence based science. Some might even say it's not scientific.
The same thing is evident using the winter data for Mississippi, as well as every other state now. Compare the weatherunderground data (published 2013) with the current data. (you will have to set the trend to end in 2012, the CAG link doesn't work correctly for trends)
After the change, no cooling trend at all.


In essence, the changes they made, which evident but are not well documented, have drastically reduced or simply erased the cooling trends which were evident and obvious. Not any more. How they did it is described as "a black box" method, it can't be replicated or reviewed by anyone else.
The http://www.ncdc.noaa.gov/ site does not allow you to use the "old" data anymore. Nor do they note the nature of the change on the CAG page.
This is an example of changing the evidence after the fact. That all the changes make the past cooler isn't a surprise, if you know the history of data changing, in regards to global warming.
They have done this before. There is abundant evidence of why many people consider the NCDC data useless.
As a scientists, I find this unacceptable in the extreme. My own research on climate has used the NCDC CAG data for years. Now every last bit of it looks "wrong", because they simply and with out a doubt, changed the past.
Every graph and all the data on the weatherunderground article is now "wrong".
Something you can check for yourself
By changing the past, they made the -.4 F cooling trend for Louisiana . -.1 F
In simple terms, by changing the past they have almost eliminated all the cooling trends for US states. It also makes the annual trend look like it's warmed more.
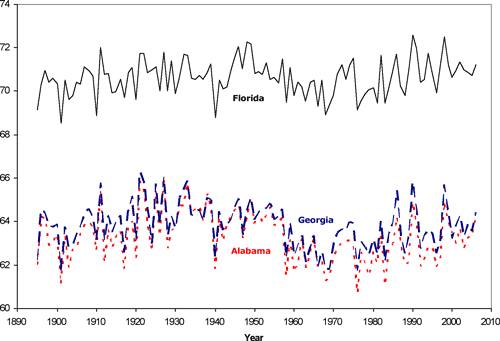
The Florida climate change page has Florida, Georgia and Alabama records before the changes.

The CAG for Alabama winter
Weather underground article discussing Alabama cooling in winter
CAG data before the change, temperatures have fallen at a rate of 0.6 degree per century.
After the change, no cooling trend at all
Changing data, changing the evidence, makes it very difficult to do evidence based science. Some might even say it's not scientific.
The same thing is evident using the winter data for Mississippi, as well as every other state now. Compare the weatherunderground data (published 2013) with the current data. (you will have to set the trend to end in 2012, the CAG link doesn't work correctly for trends)
After the change, no cooling trend at all.
Before the change, there was a -.6 F cooling trend
In essence, the changes they made, which evident but are not well documented, have drastically reduced or simply erased the cooling trends which were evident and obvious. Not any more. How they did it is described as "a black box" method, it can't be replicated or reviewed by anyone else.
The http://www.ncdc.noaa.gov/ site does not allow you to use the "old" data anymore. Nor do they note the nature of the change on the CAG page.
This is an example of changing the evidence after the fact. That all the changes make the past cooler isn't a surprise, if you know the history of data changing, in regards to global warming.
They have done this before. There is abundant evidence of why many people consider the NCDC data useless.
As a scientists, I find this unacceptable in the extreme. My own research on climate has used the NCDC CAG data for years. Now every last bit of it looks "wrong", because they simply and with out a doubt, changed the past.
Every graph and all the data on the weatherunderground article is now "wrong".
Something you can check for yourself
By changing the past, they made the -.4 F cooling trend for Louisiana . -.1 F
In simple terms, by changing the past they have almost eliminated all the cooling trends for US states. It also makes the annual trend look like it's warmed more.
The Florida climate change page has Florida, Georgia and Alabama records before the changes.
Saturday, March 22, 2014
What GISS shows you vs what really is
GISS will show you a map that minimizes the data, and uses the coldest period in the last century as a baseline for the anomalies.


This shows a more scientific view of just how cold February was, especially in the areas that saw records broken for both cold and snow.
Tuesday, March 4, 2014
GISS data on recent trends
The NH cold season, November to April, trend from GISS


Winter trends
Annual trends, polar view
Subscribe to:
Posts (Atom)