Total Pageviews

Sunday, December 14, 2014

Scientific studies and information concerning the cooling NH winter trends

The pause in global warming, which is most evident from 1998-2014 (present) is actually due to a cooling trend for NH winters (boreal winter), which is most evident in January and February, which have such strong cooling trends, those two months alone bring the annual global mean down to an almost flat trend. Here it is in scientific lingo.
The largest discrepancy between observed and simulated trends in cold extremes is found in the Northern mid-latitudes (20 °N–45 °N), where observations indicate a coherent zonal band of decreasing trends over the recent 15 years. This might be connected to the recent hiatus in the warming of global Tmean, which has been characterized mainly as a winter phenomenon (e.g., Kosaka and Xie 2013, Cohen et al 2012). (source)
Observed and simulated temperature extremes during the recent warming hiatus (archived here)
Complete paper here (full paper pdf)

Shortwave and longwave radiative contributions to global warming under increasing CO2 (full paper pdf)

Trends in hemispheric warm and cold anomalies (full paper pdf)

Recent Arctic amplification and extreme mid-latitude weather (full paper pdf)

Arctic warming, increasing snow cover and widespread boreal winter cooling (full paper pdf)

Decadal Fluctuations in Planetary Wave Forcing Modulate Global Warming in Late Boreal Winter

Tuesday, December 9, 2014

The Delaware river and climate change

William Curry is a serious, sober climate scientist, not an art critic. But he has spent a lot of time perusing Emanuel Gottlieb Leutze's famous painting "George Washington Crossing the Delaware," which depicts a boatload of colonial American soldiers making their way to attack English and Hessian troops the day after Christmas in 1776. "Most people think these other guys in the boat are rowing, but they are actually pushing the ice away," says Curry, tapping his finger on a reproduction of the painting. Sure enough, the lead oarsman is bashing the frozen river with his boot. "I grew up in Philadelphia. The place in this painting is 30 minutes away by car. I can tell you, this kind of thing just doesn't happen anymore."     But it may again. Soon. And ice-choked scenes, similar to those immortalized by the 16th-century Flemish painter Pieter Brueghel the Elder, may also return to Europe. His works, including the 1565 masterpiece "Hunters in the Snow," make the now-temperate European landscapes look more like Lapland. 
Discover article

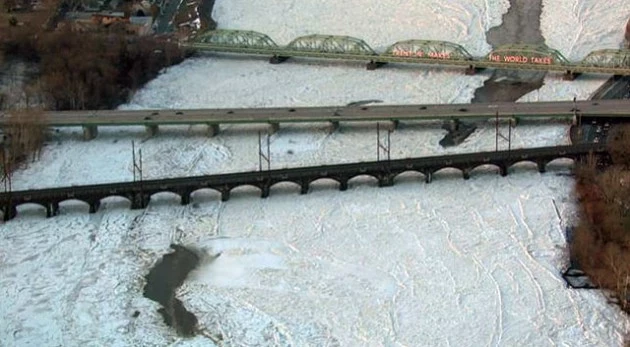
Ice Jam Takes Delaware River to Flood Stage


"Atmospheric Carbon Dioxide and Aerosols - Effects of Large Increases on Global Climate", Science, vol.173, 9 July 1971, p.138-141

ATMOSPHERIC CARBON DIOXIDE AND AEROSOLS:
Effects of Large Increases on Global Climate.

Abstract: Effects on the global temperature of large increases in carbon dioxide and aerosol densities in the atmosphere of Earth have been computed. It is found that, although the addition of carbon dioxide in the atmosphere does increase the surface temperature, the rate of temperature increase diminishes with increasing carbon dioxide in the atmosphere. For aerosols, however, the net effect of increase in density is to reduce the surface temperature of Earth. Becuase of the exponential dependence of the backscattering, the rate of temperature decrease is augmented with increasing aerosol content. An increase by only a factor of 4 in global aerosol background concentration may be sufficient to reduce the surface temperature by as much as 3.5 deg.K. If sustained over a period of several years, such a temperature decrease over the whole globe is believed to be sufficient to trigger an ice age.

The rate at which human activities may be inadvertently modifying the climate of Earth has become a problem of serious concern 1 . In the last few decades the concentration of CO2 in the atmosphere appears to have increased by 7 percent 2 . During the same period, the aerosol content of the lower atmosphere may have been augmented by as much as 100 percent 3 .

How have these changes in the composition of the atmosphere affected the climate of the globe? More importantly, is it possible that a continued increase in the CO2 and dust content of the atmosphere at the present rate will produce such large-scale effects on the global temperature that the process may run away, with the planet Earth eventually becoming as hot as Venus (700 deg. K.) or as cold as Mars (230 deg. K.)?

We report here on the first results of a calculation in which separate estimates were made of the effects on global temperature of large increases in the amount of CO2 and dust in the atmosphere. It is found that even an increase by a factor of 8 in the amount of CO2, which is highly unlikely in the next several thousand years, will produce an increase in the surface temperature of less than 2 deg. K.

However, the effect on surface temperature of an increase in the aerosol content of the atmosphere is found to be quite significant. An increase by a factor of 4 in the equilibrium dust concentration in the global atmosphere, which cannot be ruled out as a possibility within the next century, could decrease the mean surface temperature by as much as 3.5 deg. K. If sustained over a period of several years, such a temperature decrease could be sufficient to trigger an ice age!

Schneider S. & Rasool S., "Atmospheric Carbon Dioxide and Aerosols - Effects of Large Increases on Global Climate", Science, vol.173, 9 July 1971, p.138-141

(bolding is by yours truly)

Friday, December 5, 2014

Is ClimateCentral wrong?

ClimateCentral.org produced a research report claiming US winters are warming faster than ever (winter warming accelerated) and winters are warming faster than any other season.  You can read the entire report by following the link.  They used the NCDC US data available in 2012 for the report.

An example page from the report.


They describe the state of Alabama as the 48th fastest warming state , when their own chart shows even the hundred year trend is cooling. (-0.25F a decade)

(since 2012 the NCDC changed the data for the US, so that figure no longer matches the data at the NCDC)


The trend now shows as -0.1F a decade.  How data gets changed.

There main claim in the report is that winter warming has accelerated, almost everywhere.


The current NCDC data shows this is not true, and summer warming is much greater than the winter trend.  The twenty year trend shows this clearly.

US summer trend
US winter trend

This  matches the NCDC data for the NH land trend, which also shows how summers are warming, but winters are in fact, cooling for the last twenty years (trend)


The thirty year trend for the US, as well as the NH land area, also shows winters are not warming as much as summers.

US winter trend

US summer trend
These are actual displays, right from the official NCDC. The thirty year trends for the NH land only also show this.


The GISS global data also clearly shows how boreal summers are warming faster than boreal winters,

GISS winter trend
30 years of data also shows the boreal (Northern Hemisphere) summer is warming faster than winter.
Basic Global warming theory says winters have to warm faster as CO2 level rise. You can see this sort of winter warming in the GISS image below, showing the trends for 1980-1998


The last 17 years shows a cooling trend for boreal winters, which matches the NCDC global land data, as well as the US data.


Looking at the last 13 years Land only data shows just how different boreal summer and boreal winter trends are. 

Summers are warming.


Looking at the Zonal mean data shows just how different the boreal winter changes are now, compared to 1980-1998

GISS zonal data for winter trend 1998-2014
GISS zonal data for winter trend 1980-1998

The US data matches this, with a clear trend of cooling winter temperatures, and warming summer temperatures.


US summer trend for last 13 years


US winter trend for last 13 years

Sources of data and images for this entry

Commentary

The new paper from MIT scientist may have the answer to why winters are cooling, rather than warming.


Thursday, November 6, 2014

Are Volcanic Eruptions Changing the Climate?

Volcanic Eruptions May Slow Global Warming


Volcanic Eruptions Could be Slowing Down Global Warming

Volcanic Eruptions

A combination of a solar minimum, and volcanoes, is believed to be the cause of the Little Ice Age.  Of course there is no way to actually predict what will happen, but that never stopped anyone.

Russian scientist issues global cooling warning

15:53 25/08/2006
ST. PETERSBURG, August 25 (RIA Novosti)- Global cooling could develop on Earth in 50 years and have serious consequences before it is replaced by a period of warming in the early 22nd century, a Russian scientist said Friday.
Environmentalists and scientists today focus on the dangers of global warming provoked by man's detrimental effect on the planet's climate, but global cooling - though never widely supported - is a theory postulating an overwhelming cooling of the Earth which could involve glaciation.
"On the basis of our [solar emission] research, we developed a scenario of a global cooling of the Earth's climate by the middle of this century and the beginning of a regular 200-year-long cycle of the climate's global warming at the start of the 22nd century," said the head of the space research sector of the Russian Academy of Sciences' astronomical observatory.
Khabibullo Abdusamatov said he and his colleagues had concluded that a period of global cooling similar to one seen in the late 17th century - when canals froze in the Netherlands and people had to leave their dwellings in Greenland - could start in 2012-2015 and reach its peak in 2055-2060.
Solar activity heads for lowest low in four centuries


Thursday, October 16, 2014

Trying to explain the obvious once more, the xkcd Cold comic

xkcd "Cold" (I love xkcd)

After some thought, and some research, there may be a way to show, in a scientific manner one of the core disputes.  Experience has taught one thing for sure, that its 'impossible to to get through to a closed mind, but it is the internet, you never know.

The winters in MO warmed up after the cold sixties and the extremely cold seventies.  You can see that on the official MO climate center site.  The data clearly shows the cold period changed to a warm period.  Winters were trending warmer.

You can see it on the GISS map


and you can easily see it on the NCDC graph as well.


Because we have more data after 1993, it is doubtful anyone would object to stating the facts, that winters were warming in MO, and 1993 was part of a trend.  Even with the winters of 93 and 94 being colder than the previous warm winters, it's still obvious that the winters were warming.  (of course now we have the rest of the nineties, there is no doubt about the warming trend)

If somebody objected (and they did) that it was too short a time period, you could move it back to 1970, giving 24 years for the trend.


Sea level

http://joannenova.com.au/2014/06/sea-level-rise-less-than-1mm-for-last-125-years-nils-axel-morner/

EODIS views

EOSDIS view of Greenland

Changing the data goes mainstream

http://www.washingtontimes.com/news/2014/jun/23/editorial-rigged-science/

http://www.telegraph.co.uk/earth/environment/10916086/The-scandal-of-fiddled-global-warming-data.html

http://sunshinehours.wordpress.com/2014/06/25/noaa-usa-july-1936-maximum-temperatures-top-3-are-1936-1934-and-1901/

https://sunshinehours.wordpress.com/2014/06/28/ushcn-2-5-omg-the-old-data-changes-every-day-2/

http://stevengoddard.wordpress.com/2014/06/26/it-gets-more-bizarre-by-the-hour/#comment-376700

http://stevengoddard.wordpress.com/2014/06/01/more-than-40-of-ushcn-station-data-is-fabricated/

http://wattsupwiththat.com/2014/06/28/the-scientific-method-is-at-work-on-the-ushcn-temperature-data-set/

http://blog.hotwhopper.com/2014/06/noaa-and-temperature-data-it-must-be.html

The Heisenberg failure

Heisenberg failed in many ways while developing, or trying to develop a working reactor, and of course atomic bombs during WWII.   This is attributed by Bodanis (and others of course) to the facts that he was a theorist, while many of the others working on the same problem were trained as engineers,  And the German educational system, and the fascist mentality, which Heisenberg personified, preventing his subordinates from even mentioning his errors, much less solving fundamental problems that he had in fact created by using theoretical methods, rather than practical engineering.

This applies to current climate research, where open hostility and a refusal to even consider any other ideas when it comes to solving large problems for general circulation models.

These include (but not limited to) solar physics, atmospheric chemistry, biological forcings, clouds, precipitation, ocean circulation, large scale atmospheric changes, snow and ice, other pollutants besides CO2, vulcanism, especially undersea activity and under the ice sheets.

 The list goes on and on.

Monday, August 18, 2014

Folsom Lake propaganda from

20 powerful photos at metapicture.com Some of them nonsense cherry picking. 


Trying to make it seem like extreme drought.  Current data shows it is already almost full again.  The first photo is July, during a wet year.  The second is January, the time it is lowest, during a drought year.  Propaganda, cherry picking, shameless unscientific efforts.

Interesting that the page still says 17 August, 2013, while they use a photo from 2014

Sunday, June 29, 2014

The Keeling Curve and modern CO2 data

From Wikipedia
The Keeling Curve also shows a cyclic variation of about 5 ppmv in each year corresponding to the seasonal change in uptake of CO2 by the world's land vegetation. Most of this vegetation is in the Northern hemisphere, since this is where most of the land is located. From a maximum in May, the level decreases during the northern spring and summer as newplant growth takes carbon dioxide out of the atmosphere through photosynthesis. After reaching a minimum in October, the level rises again in the northern fall and winter as plants and leaves die off and decay, releasing the gas back into the atmosphere.[13]

When C.D. Keeling published his 1960 paper, there did not appear to be any evidence of oceanic absorption. Keeling conjectured that this might be attributable to fluctuations in the causation of the seasonal variation, within the small number of years since his measurements had begun. However it is now understood that allowance should be made for about 50% absorption by the oceanic sinks.[17]

------------------------------------------------------

Satellite derived data of seasonal CO2

Cooling of Atmosphere Due to CO2 Emission

(behind paywall, found most of it here)
Conclusions
During the latest three millennia, one can observe a clear cooling trend in
the Earth's climate (Keigwin, 1996; Sorokhtin and Ushakov, 2002; Gerhard,
2004; Khiyuk and Chilingar, 2006; Sorokhtin et al., 2007). During this
period, deviations of the global temperature from this trend reached up to
3iC with a clear trend of decreasing global temperature by about 2iC.
Relatively short-term variations in global temperature are mainly caused by
the variations in solar activity and are not linked to the changes in carbon
dioxide content in atmosphere.
Accumulation of large amounts of carbon dioxide in the atmosphere leads to
the cooling, and not to warming of climate, as the proponents of traditional
anthropogenic global warming theory believe (Aeschbach-Hertig, 2006). This
conclusion has a simple physical explanation: when the infrared radiation is
absorbed by the molecules of greenhouse gases, its energy is transformed
into thermal expansion of air, which causes convective fluxes of air masses
restoring the adiabatic distribution of temperature in the troposphere. Our
estimates show that release of small amounts of carbon dioxide (several
hundreds ppm), which are typical for the scope of anthropogenic emission,
does not influence the global temperature of Earth's atmosphere.
References
Arrhenius, S. 1896. On influence of carbonic acid in the air upon the
temperature of the ground. Phil. Mag. 41:237-276.
Aeschbach-Hertig, W. 2007. Rebuttal of "On global forces of nature driving
the Earth's climate. Are humans involved?" by L. F. Khilyuk and G. V.
Chilingar. Env. Geol.
Bachinskiy, A. I., Putilov, V. V., and Suvorov, N. P. 1951. Handbook of
Physics. Moscow: Uchpedgiz, 380 pp.
Gerhard, L. C. 2004. Climate change: Conflict of observational science,
theory, and politics. Am. Assoc. Petrol. Geol. Bull. 88:1211-1220.
Keigwin, L. D. 1996. The little ice age and medieval warm period in the
Sargasso Sea. Science 274:1504-1508.
Khilyuk, L. F., Chilingar, G. V., Endres, B., and Robertson, J. 2000. Gas
Migration. Houston: Gulf Publishing Company, 389 pp.
Khilyuk, L. F., and Chilingar, G. V. 2003. Global warming: Are we confusing
cause and effect? Energy Sources 25:357-370.
Khilyuk, L. F., and Chilingar, G. V. 2004. Global warming and long-term
climatic changes: A progress report. Environ. Geol. 46:970-979.
Khilyuk, L. F., and Chilingar, G. V. 2006. On global forces of nature
driving the Earth's climate. Are humans involved? Environ. Geol. 50:899-910.
Landau, L. D., and Lifshits, E. M. 1979. Statistical Physics. Moscow: Nauka,
559 pp.
Marov, M. Ya. 1986. Planets of Solar System, Moscow: Nauka, 320 pp.
Robinson, A. B., Baliunas, S. L., Soon, W., and Robinson, Z. W. 1998.
Environmental effects of increased atmospheric carbon dioxide.
[in...@oism.orgin...@marshall.org]
Schimel, D. S. 1995. Global Change Biology, 1:77-91.
Sorokhtin, O. G. 1990. The greenhouse effect of atmosphere in geologic
history of Earth. Doklady AN SSSR 315:587-592.
Sorokhtin, O. G. 2001a. Greenhouse effect: Myth and reality. Vestnik Russian
Academy of Natural Sciences 1:8-21.
Sorokhtin, O. G. 2001b. Temperature distribution in the Earth. Izvestiya
RAN, Physics of Earth 3:71-78.
Sorokhtin, O. G., and Ushakov, S. A. 2002. Evolution of the Earth. Moscow:
Moscow Univ. Publishers, 560 pp.
Sorokhtin, O. G., Chilingar, G. V., and Khilyuk, L. F. 2007. Global Warming
and Global Cooling. Evolution of Climate on Earth. Amsterdam: Elsevier, 313
pp.
Sorokhtin, O. G., Chilingar, G. V., Khilyuk, L. F., and Gorfunkel, M. V.
2006. Evolution of the Earth's global climate. Energy Sources 29:1-19.
Venus (Atmosphere, Surface and Ecosystem). 1989. Moscow: Nedra, 482 pp.
Voytkevitch, G. V., Kokin, A. V., Miroshnikov, A. E., and Prokhorov, V. G.
1990. Handbook of Geochemistry. Moscow: Nedra, 480 pp.
Sunday, May 18, 2014

It's easy to explain to a skeptic

If you are skeptical. it's easy to show you why I suspect the climate data has serious issues.  For example, the GISS data does not match the Alaska climate data.  All stations except Barrow show cooling trend since 1979.  Barrow shows a warming trend.

GISS map showing Alaska annual trend for 1978-2013


Actual data from climate stations


A climate skeptic probably doesn't even need it explained.  A believer, it will not matter how carefully, how well, or how much evidence is used to explain.  They always have a way to avoid discussing, or even seeing the evidence.


Online resources for science

I'm putting them all on one page here

Wednesday, May 7, 2014

The NCDC changed temperature data of the past again

Recently past temperatures used by the NCDC CAG were changed, all of the changes resulted in making the past cooler.  This is not a secret.  But it clearly shows  up when comparing their data now, to data used before the change.
The CAG for Alabama winter
Weather underground article discussing Alabama cooling in winter

CAG data before the change, temperatures have fallen at a rate of 0.6 degree per century.


After the change, no cooling trend at all


Looking at the exact same winter trend now shows no cooling at all.  That is a huge change.  The changes they made also makes all previous papers based on CAG wrong.

Changing data, changing the evidence, makes it very difficult to do evidence based science.  Some might even say it's not scientific.

The same thing is evident using the winter data for Mississippi, as well as every other state now.  Compare the weatherunderground data (published 2013) with the current data. (you will have to set the trend to end in 2012, the CAG link doesn't work correctly for trends)

After the change, no cooling trend at all.

Before the change, there was a -.6 F cooling trend


In essence, the changes they made, which evident but are not well documented, have drastically reduced or simply erased the cooling trends which were evident and obvious.  Not any more.  How they did it is described as "a black box" method, it can't be replicated or reviewed by anyone else.

The http://www.ncdc.noaa.gov/ site does not allow you to use the "old" data anymore.  Nor do they note the nature of the change on the CAG page.

This is an example of changing the evidence after the fact.  That all the changes make the past cooler isn't a surprise, if you know the history of data changing, in regards to global warming.

They have done this before.  There is abundant evidence of why many people consider the NCDC data useless.

As a scientists, I find this unacceptable in the extreme.  My own research on climate has used the NCDC CAG data for years.  Now every last bit of it looks "wrong", because they simply and with out a doubt, changed the past.

Every graph and all the data on the weatherunderground article is now "wrong".

Something you can check for yourself

By changing the past, they made the -.4 F cooling trend for Louisiana . -.1 F

In simple terms, by changing the past they have almost eliminated all the cooling trends for US states.  It also makes the annual trend look like it's warmed more.

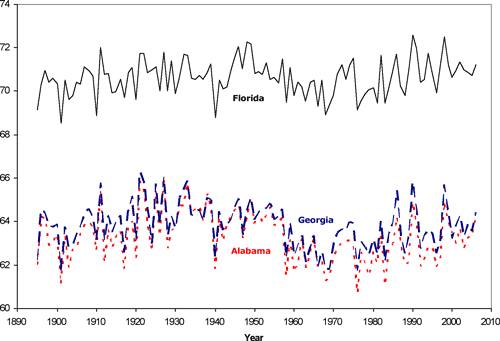
The Florida climate change page has Florida, Georgia and Alabama records before the changes.


Saturday, March 22, 2014

What GISS shows you vs what really is


GISS will show you a map that minimizes the data, and uses the coldest period in the last century as a baseline for the anomalies.

This shows a more scientific view of just how cold February was, especially in the areas that saw records broken for both cold and snow.


Tuesday, March 4, 2014

GISS data on recent trends

The NH cold season, November to April, trend from GISS

Winter trends

Annual trends, polar view