Recently past temperatures used by the
NCDC CAG were changed, all of the changes resulted in
making the past cooler. This is not a secret. But it clearly shows up when comparing their data now, to data used before the change.
The CAG for Alabama winter
Weather underground article discussing Alabama cooling in winter
CAG data before the change,
temperatures have fallen at a rate of 0.6 degree per century.
After the change, no cooling trend at all

Looking at the exact same winter trend now shows no cooling at all. That is a huge change. The changes they made also
makes all previous papers based on CAG wrong.
Changing data, changing the evidence, makes it very difficult to do evidence based science. Some might even say it's not scientific.
The same thing is evident using
the winter data for Mississippi, as well as every other state now. Compare
the weatherunderground data (published 2013) with the current data. (you will have to set the trend to end in 2012, the CAG link doesn't work correctly for trends)
After the change, no cooling trend at all.
Before the change, there was a -.6 F cooling trend
In essence, the changes they made,
which evident but are not well documented, have drastically reduced or simply erased the cooling trends which were evident and obvious. Not any more. How they did it
is described as "a black box" method, it can't be replicated or reviewed by anyone else.
The http://www.ncdc.noaa.gov/ site does not allow you to use the "old" data anymore. Nor do they note the nature of the change on the CAG page.
This is an example of changing the evidence after the fact. That all the changes make the past cooler isn't a surprise, if you know the history of data changing, in regards to global warming.
They have done this before.
There is abundant evidence of why many people consider the NCDC data useless.
As a scientists, I find this unacceptable in the extreme. My own research on climate has used the NCDC CAG data for years. Now every last bit of it looks "wrong", because they simply and with out a doubt, changed the past.
Every graph and all the data on the weatherunderground article is now "wrong".
Something you can check for yourself
By changing the past, they made the -.4 F cooling trend for Louisiana . -.1 F
In simple terms, by changing the past they have almost eliminated all the cooling trends for US states. It also makes the annual trend look like it's warmed more.
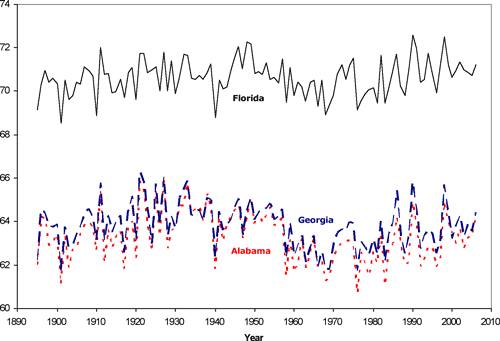
The Florida climate change page has Florida, Georgia and Alabama records before the changes.